🇺🇸 Central Florida Home Sales for July 2025 — National Trends
Central Florida Home Sales for July 2025 begins with a quick look at the national picture. Total existing-home sales ran at a seasonally adjusted annual rate of about 4.31 million. That was a nudge higher from early spring and roughly flat year over year (≈+0.8%). The national median price clocked in at $426,900. Prices continue a gradual, multi-year climb even as buyers remain rate-sensitive. Moreover, the South continues to dominate activity, accounting for about 46% of all deals. This sets the backdrop for what’s happening across Central Florida.
On the ground, buyers nationwide still face lean (but improving) selection and faster timelines than historic norms. However, sellers who price close to market are still finding success. The bidding-war fireworks of 2021–22 are gone, yet steady activity remains in Central Florida, especially in July 2025.
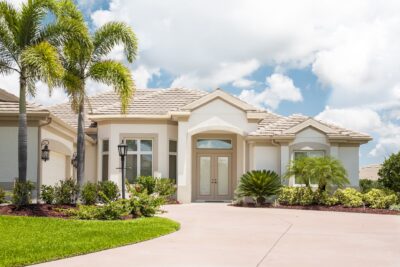
🌇 Central Florida Home Sales for July 2025 — Orlando MSA
Sales Activity & Pace
Orlando posted 2,591 single-family closings in July. That was a modest 1.2% dip from last year but still a healthy summer volume. Median time to contract stretched to 39 days (from 27). Median time to sale reached 78 days. Consequently, these longer timelines reflect a balanced market rather than a slowdown. In July 2025, Orlando’s home sales showcased a nuanced market balance.
Pricing: Steady at High Levels
The July median sale price landed at $444,028 (-0.9% YoY). The average sale price ticked up to $558,539 (+2.7% YoY). Total dollar volume held near $1.4B. That was up 1.5% year over year and shows demand remains resilient. In addition, affordability continues to shape what buyers choose.
Inventory & Months’ Supply
Active listings finished the month at 10,857. That was about 26% higher than a year ago. Months’ supply moved to 4.6. As a result, buyers now have more choice, and sellers must price with precision.
New Listings, New Pendings & Deal Dynamics

New listings came in at 3,504 (-0.6% YoY). New pending sales tallied 2,533 (-4.2% YoY). Sellers received a median 96.3% of original list price. That’s still solid. However, there is less room for stretch pricing. Cash made up 509 of July’s sales (≈19.6%), down slightly from last year.
How to Read Orlando’s Market
For buyers, higher inventory and steady prices mean more leverage on terms. That includes repairs, concessions, and closing timelines. For sellers, clean pricing and turnkey prep remain key. Homes aligned with comps still move. On the other hand, aspirational asks take longer and see more price discovery along the way.
Deep-Dive Data
Want to roll up your sleeves? The ORRA State of the Market Report includes 13-month trend charts and five years of historical data. In particular, it is an excellent resource for spotting neighborhood-level patterns and seasonal shifts in the Orlando housing market.
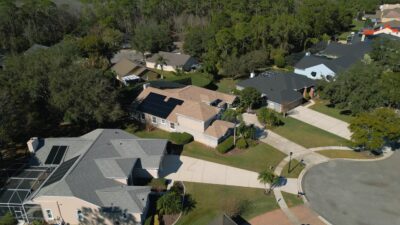
🌴 Central Florida Home Sales for July 2025 — Tampa Bay
Snapshot
Tampa–St. Pete–Clearwater closed 3,508 single-family sales in July (-3.3% YoY). Median price registered $405,000 (-2.6% YoY). The average price came in at $504,161 (-3.5% YoY). Sellers captured a median 95.7% of original list price. Median time to contract was 39 days and time to sale 79. Therefore, Tampa remains stable even as conditions gradually normalize with July 2025 being a pivotal month.
Supply & Selection
Active inventory rose to 14,168 (+11.3% YoY). Months’ supply reached 4.4, just shy of balanced. New listings (4,531) outpaced new pendings (3,439). Consequently, buyers gained breathing room and more negotiating latitude.

Takeaway
Tampa Bay feels like a middle-lane market. It is no longer tilted heavily toward sellers but not yet a buyer’s market. Price sensitivity is growing around properties needing updates. For example, move-in-ready homes in top school zones continue to attract strong attention.
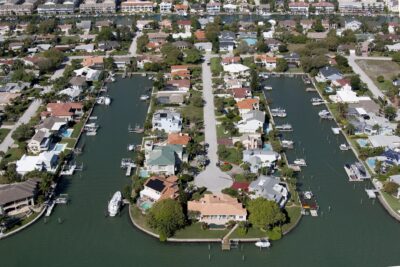
🏖️ Central Florida Home Sales for July 2025 — Daytona Beach
Snapshot
Deltona–Daytona Beach–Ormond Beach logged 989 single-family closings in July (-2.1% YoY). The median price settled at $350,000 (-1.2% YoY). Meanwhile, the average sale price hovered at $415,291 (-0.5% YoY).
Inventory & Pace
Active listings climbed to 5,118 (+20.5% YoY). Months’ supply hit 5.7. That leans toward buyers in many sub-markets. Median time to contract was 56 days and time to sale 89 days. Both metrics rose compared to last year. As a result, buyers have genuine negotiating power in the Central Florida home sales for July 2025.
List-to-Sale & Cash Shares
Sellers received a median 94.7% of original list price. That was down 1.1 percentage points YoY. Cash made up 29.2% of closings, typical for a coastal market with investor and second-home demand. In other words, strong cash activity continues to shape outcomes. Total dollar volume landed near $410.7M (-2.5% YoY).
📊 What the National Picture Means for Central Florida Home Sales in July 2025
National sales were flat YoY and prices edged higher. Central Florida’s July results reflect a late-cycle normalization. Inventory is higher than 2023. Timelines are longer but manageable. Median prices remain sticky. Orlando sits closest to balance, Tampa is nearly there, and Daytona leans toward buyers with 5.7 months of supply. Therefore, sellers must focus on presentation and pricing. Buyers benefit from patience and pre-approval.
📅 Central Florida Home Sales for July 2025 — Monthly Reports
Keep up with regional housing trends across Orlando, Tampa Bay, and Daytona Beach each month.


Orlando Florida Home Sales for February 2024
Orlando Florida Home Sales The latest housing data is in, and we’re breaking down the numbers for Greater Orlando in this edition of Orlando Florida Home Sales February 2024. Sales dipped slightly while inventory and prices both climbed—let’s take a closer look. February 2024 Sales Summary A total of 2,174 homes were sold during February […]
👉 Contact Jean Scott Homes today for expert strategies tailored to your local market.